
The summer did not slow the ecosystem down. Since the beginning of August, three subjects have kept coming back, and underneath they tell the same story.
In short:
- AI in IT teams is profitable, and it saves time for almost no one. Of the 844 professionals surveyed by SolarWinds, 84% say the return on investment has been met or exceeded, and 71% report no reduction in workload at all. Time saved on one side is taken back on the other, in maintenance and review.
- VictoriaMetrics fixed an authentication flaw in its observability platform in late August. Some of the product’s addresses answered without asking for the password. If you run this tool, that update is the priority of the month, ahead of everything else.
- We are done talking about resilience, we are starting to measure it. Several vendors published the same idea in September: what matters is no longer the uptime figure on the slide, it is what your users experience during the outage, and how long it takes to understand what is happening.
A word on vocabulary, because it is shifting in these pages as it is shifting in the trade. We said monitoring when the question was whether a server answered or not. We say observability now that the job is also to understand why it behaves the way it does, and what that means for the people using it. The rest of this edition is about that.
The payoff is real, the relief is not
Let us start with the number that went around the industry. On 18 August SolarWinds published its annual study on IT service management, based on 844 professionals across North America, EMEA and Asia-Pacific, then detailed the findings on 8 September. The vendor’s headline talks about a gap between AI’s potential and its payoff, and the numbers are more interesting than the headline.
Source: 2026 State of ITSM, SolarWinds, published 18 August, detailed on 8 September.
On one side, the profitability is real: 84% of respondents say the return on investment has been met or exceeded. On specific tasks, the gains are measurable: around 3.3 hours a week on detecting and flagging incidents, 2.7 hours on resolving them. On the other side, 52% say their workload has increased since adopting AI, and 19% say it has stayed the same. In other words, 71% of teams do not work any less.
Where does the saved time go? The study is fairly precise about it: 83% of respondents spend at least three hours a week maintaining their AI tools, and 44% spend six or more. In detail, 48% spend time administering those tools, and 47% reviewing and validating what they produce. The work has not disappeared, it has changed shape. Nobody is hunting for the anomaly any more, they are checking that the machine tasked with hunting for it is not getting it wrong.
The three drifts it describes are worth knowing, because none of them looks like an outage. First, a model that quietly gets worse: its accuracy on a given task falls from 84% to 51% from one version to the next, with nobody announcing it. Then a leak of information: to keep a record of what happens, the full question sent to the model is stored, and with it, sometimes, in-house code. And finally a bill that climbs for weeks before anyone works out that the system is asking its question over and over. None of the three raises an alert on a classic dashboard, and all three are expensive.
Nobody is hunting for the anomaly any more, they are checking that the machine hunting for it is not talking nonsense.
That is exactly what New Relic describes in a post published on 9 September, one of the most concrete pieces we have read this year on the subject. The vendor explains how it fitted measurements to a language model “router”, the small piece of software that decides, for each question asked, which AI model will answer it. Its argument: classic observability tools answer the question “is the service up”, not the question “is the router making good decisions”. Without measurements built for it, that component is a black box choosing on its own, with no visibility into what it decides on, or what it costs.
Diana Todea, at VictoriaMetrics, makes a very similar point in a post dated 12 August on automatic anomaly detection. Her argument is simple, and it holds well beyond her own product: a model that flags an anomaly is only worth something if the team can check what it based that on and hold it against what they know of the ground. Without that grounding, you are swapping an alert you do not understand for another, more sophisticated one you still do not understand.
Another shift over these six weeks, these agents are earning the right to act, not just to advise. New Relic’s August release notes add a GitHub integration to its Autopilot agent, along with workflow automation actions into Jira and Ansible. In plain terms, the agent no longer just writes a diagnosis: it can open a ticket, propose a fix in the code, kick off an automated procedure on the servers. At SolarWinds, the SW1 agent platform launched in the spring goes the same way, to the point that the executive behind it, Cullen Childress, has just been named interim chief executive.
For an IT department, the consequence is easy to state and less easy to implement: the AI used in IT operations has become a recurring cost, and a job in its own right. It has to be budgeted as such, including the maintenance and review time it consumes, and you need to be able to observe what it does. An agent allowed to write into Jira, GitHub and Ansible deserves at least as much traceability as a human administrator.
Who observes the observer
The most serious security item of these six weeks went almost unnoticed. On 28 August VictoriaMetrics, the tool that stores the measurements collected across your infrastructure, widely used in modern architectures, published versions v1.151.0 and v1.148.3 with an authentication fix. The problem: the password meant to protect access could be bypassed on certain addresses of the product, the ones ending in /config or /reload. The vendor’s own example says it well: a request to /api/v1/import/prometheus/config reached the component that receives data, without being asked for a single credential. Four components are affected, the ones that receive data as much as the ones that serve it.
It is worth weighing what that means. An observability tool sees the whole information system, that is its purpose. An unauthenticated way into the ingestion component means being able to inject false metrics, and therefore to blind the very thing that is watching, at the exact moment you need it. The instruction is straightforward: if VictoriaMetrics runs in your environment, move to v1.151.0, or v1.148.3 if you follow the long-term support branch, the one that favours stability. If the product is reachable beyond your internal network, do it this week.
It is not the only fix of its kind in the period. In late July, v1.149.0 had already locked down two addresses that allowed data to be deleted, to block a type of attack in which a stranger gets a trusted server to run their request for them. And on 17 August, v1.150.0 and v1.148.2 were rebuilt on Go 1.26.6, following the ten security fixes published by the Go team on 11 and 13 August. That last point is worth pausing on, for a reason that goes beyond VictoriaMetrics: when a flaw is fixed in a programming language, every piece of software written in it has to be recompiled and republished. The vendor did it in under two days. That is a maturity signal worth watching more often than a feature list.
A final word on an alert that circulated in August and never existed. Several sites relayed eleven vulnerabilities fixed in Zabbix, two of them rated high. We checked at the source: the official Zabbix security advisory register has contained nothing since 6 May 2026. Nothing in August, nothing in September. So we are not relaying that alert. If someone forwarded it to you, it matches no publication by the vendor, and the reflex that settled it fits in one sentence: for a security flaw, the only source that counts is the vendor’s own.
We stop talking about resilience and start measuring it
A third subject, quieter, and it joins the first two. Several vendors published texts in August and September saying the same thing in different words: the uptime figure proves nothing, what counts is what the user experiences during the incident.
ip-label was the most explicit. In a post dated 2 September, the vendor argues that resilience is not the absence of failure, but the ability to understand the disruption, limit its effects and keep the services that matter running. It draws a distinction between two notions that often get blurred at the moment: digital sovereignty, which is about control over data and infrastructure, and operational resilience, which is about how the service behaves during the outage. A sovereign technology is not immune to failure. The cycle it proposes has five steps: detect, diagnose, respond, recover, improve. The measurement method is classic but demanding: observe real users, and continuously replay critical journeys end to end.
VictoriaMetrics approaches the same subject from a different angle, with a post on 11 September under a well-chosen title, “the most expensive half-hour of an incident”. That half-hour is the diagnosis window, the moment when nobody knows where to look yet. It is precisely what resilience measurement tries to shorten, and it is also where AI tools promise the most, which brings us back to the first subject.
The same concern, on more technical ground. On 9 September Paessler announced that its PRTG multi-platform probe is dropping NATS in favour of QUIC, the modern transport protocol that underpins much of today’s web. Two claimed benefits, and both are about resilience. The first is a smaller attack surface: no more hosting, patching and maintaining a dedicated NATS server, so one fewer component to watch. The second is behaviour on unstable links, with explicit attention to mobile sites, ships and satellite connections, where a connection that changes address no longer cuts off collection. Two practical points for the teams concerned: traffic moves to port 23563 over UDP, with a TCP fallback, and the configuration wizard has to be run again to generate a new token. The target is PRTG 126, before the end of the year.
Also worth noting
Centreon shipped its updates like clockwork: the 25.10 series on 2 September, 24.10 on the 3rd, the mapping module on the 10th. One calendar point worth putting in your plans: version 25.10 is supported until April 2027, and 24.10, a long-term support version, until October 2027. If you are still on 24.04, it has been out of support since April 2026. Zabbix shipped its 7.4.14 and 7.0.30 maintenance releases on 25 August, then detailed a set of improvements to its cloud offering on 9 September, including the ability to install its collection relays at the host directly, with no machine to provide. The Zabbix Summit takes place in Riga on 8 and 9 October. New Relic opened its Japan region on 31 August and published, on 11 September, an interesting reflection on why OpenTelemetry, the open standard for observability, has prevailed: less through vendor neutrality than because it gives platform teams a clear contract to offer developers. M81 has announced its second-half webinar programme, including one on IBM i high availability compared with snapshot strategies, and will be at Navigate from 26 to 29 October.
Our usual transparency on silences: Mr Suricate has published nothing since 20 July. Martello released its quarterly results on 13 August, down 7% at $2.87M but back to a net profit, and announced nothing in September; the vendor continues to refocus on the Mitel segment following the end of sale of Vantage DX.
Dates for the diary
- 8 and 9 October: Zabbix Summit in Riga, certified training from the 13th to the 17th.
- 15 October: our meetup in Nantes, with VictoriaMetrics.
- 26 to 29 October: Navigate, with the M81 team.
- Before the end of 2026: PRTG 126 and the multi-platform probe moving to QUIC, worth planning for on the firewall side.
- April 2027: end of support for Centreon 25.10. October 2027 for 24.10.
Our meetup on 15 October, in Nantes
A short aside, following directly from everything above. We are hosting a meetup on Thursday 15 October 2026, from 6pm to 8pm, in Nantes, on observability. Diana Todea, Head of Developer Relations Engineering at VictoriaMetrics, will be joining remotely to talk about VictoriaMetrics Cloud and the platform’s latest features. She is the author of the 12 August post on anomaly detection referenced earlier in this edition, so it is a chance to put the questions that kind of piece leaves open directly to her.
Sensor Factory is a VictoriaMetrics reseller partner. The partnership rests on production deployments at our customers rather than on a commercial agreement alone, which is what allows us to write about it precisely. Depending on the context, we supply the platform, or we work on the tool already in place.
The format is deliberately accessible: technical and non-technical profiles mixed, no prerequisites. If observability is not your day job, the evening is built for you too. The exact address and the detailed programme will be announced shortly. To hear first, or simply to tell us you are coming, get in touch.
What to take away
- Budget for maintaining AI, not just for licensing it. Three to six hours a week per person is the measured order of magnitude. Operational AI deployed without planning for that time produces disappointment, not savings.
- The technical priority of the month is the VictoriaMetrics update. v1.151.0, or v1.148.3 on the long-term support branch. Everything else can wait a week, this update cannot.
- Check security alerts at the source. The eleven Zabbix flaws of August never existed. The vendor’s official register has been empty since 6 May, and it is the only reference that counts.
On our side: SenHub Agent 0.5.5 and Toise
Our two open source projects are natively OpenTelemetry-compatible. SenHub Agent collects the data, infrastructure and databases included, in a standardised and portable way: it stays yours, with no proprietary lock-in. Toise maps the entities of your information system and their dependencies, with their history, and answers the impact question: if this component fails, or if an agent modifies it, what does that affect? The three subjects of this edition kept us busy too.
The console becomes a real configuration desk. That is the bulk of 0.5.5, in beta since 10 September, and it changes the day-to-day work of those running the agent. Until now, declaring a probe meant editing a configuration file. You can now create one, edit it and above all test it from the interface: the agent validates the configuration, runs a trial collection and shows the result before anything is saved. The screen also says why a probe is failing and which destinations have stopped receiving, instead of leaving you to guess. Every probe and every destination now declares the schema of its parameters, marking what is essential to start and what only matters in certain cases, so the interface can guide rather than demand a manual.
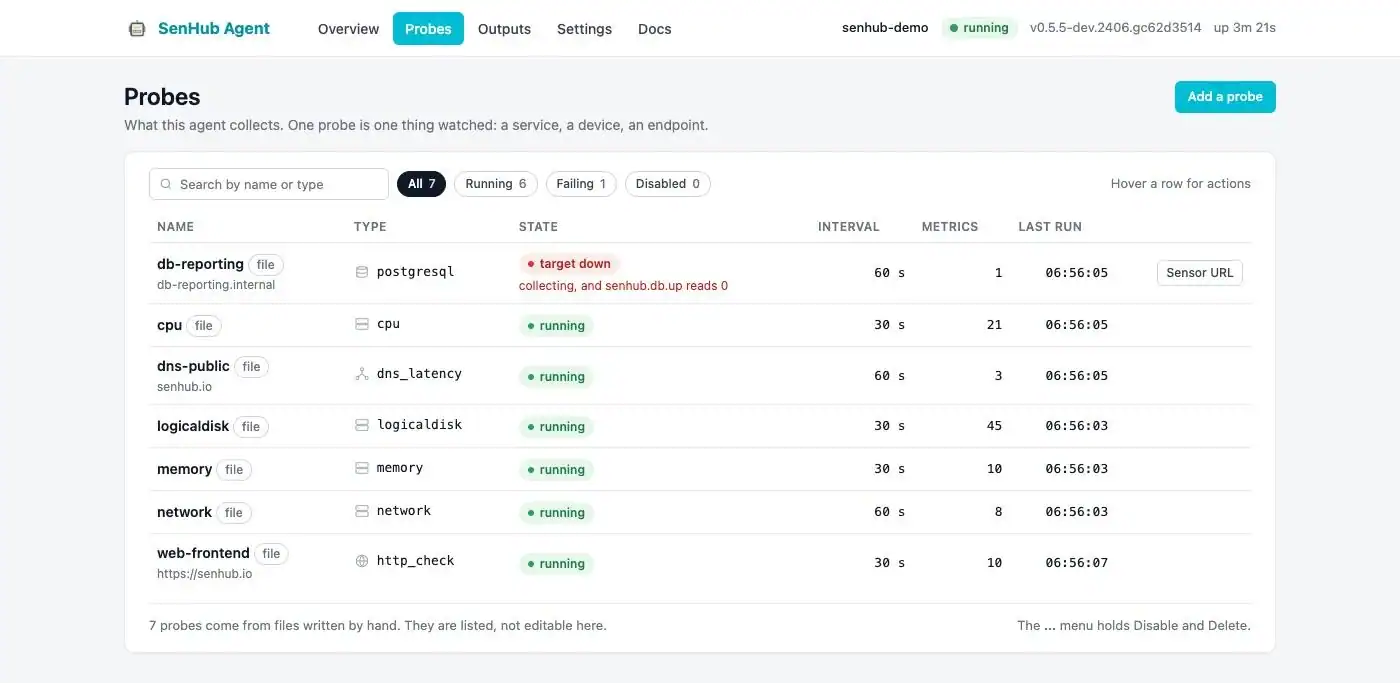
Governance attached to each probe. The other addition in 0.5.5 will matter most to organisations monitoring on behalf of several entities, subsidiaries, customers or business units. You can now attach a governance block to each probe instance, and that information is stamped onto the measurements, the logs and the entities the probe observes. In the same spirit, the owner and the location declared on a machine now descend automatically onto everything it runs. In other words, the answer to “who owns this data, and where was it produced” is no longer reconstructed after the fact, it travels with the data.
In the Enterprise edition, the paid probes gained an azure_container_apps probe in early September, which picks up the log stream of a containerised application on Azure. The interesting work is not the collection itself but everything around it: dropping lines at the source rather than shipping what will be discarded, publishing how much of the Azure call budget is left, backing off when the platform refuses, and pulling back automatically from a container stuck in a restart loop. A probe that saturates a provider’s API creates the very problem it was meant to detect.
The same chain of Go fixes as everyone else. When the Go team published its ten security fixes on 11 and 13 August, we rebuilt the agent on them and shipped 0.5.4 on 18 August. 0.5.3, on 3 August, had completed the signing of the Windows installers, and the work in progress for the final release adds the list of embedded third-party components, generated from the build instead of maintained by hand. For an IT department, that is what makes it possible to answer, without an investigation, the question of what exactly is running on your servers.
Toise: an answer that says what it does not know. This is the change we are happiest with this month, and it speaks directly to the problem New Relic described earlier. Since version 0.16.0, published on 1 September, every answer Toise gives an AI agent declares its own scope and freshness: what it covers, and how recent it is. An agent querying the map therefore knows what it does not know, instead of drawing conclusions from a partial view without noticing. It is a simple condition, and a rarely met one, for letting an agent work without watching it constantly. Over the same period the map learned to represent Kubernetes pods and network segments with their attachments, retention periods became tunable per customer, and the audit preparing the interface freeze ahead of a 1.0 release is open. The entity vocabulary keeps following the OpenTelemetry “Resources and Entities” work rather than an in-house format.

What we are doing with it at Sensor Factory
In practice, over this period, we handled the VictoriaMetrics update for the customers concerned, reviewed Centreon versions against end-of-support dates, and started documenting a simple set of rules for these agents with several IT departments: what they are allowed to do, a log of what they change, and a human validating any action that changes something. Nothing spectacular, but it is the difference between a useful agent and an agent whose logs nobody consults.
If you want to review your own estate, priority patches, end-of-support calendar or keeping a grip on agents, let’s talk. Previous editions are in our tech watch section.
For technical teams: the version rundown
- VictoriaMetrics: v1.151.0 and v1.148.3 (dated 28 August, published on the 31st: fix for the HTTP Basic Auth bypass on paths ending in
/configand/reloadforvmsingle,vmagent,vminsert,vmselect; Unix socket listening via-httpListenAddr;vm_app_prev_shutdown_uncleangauge andUncleanShutdownalerting rule; fix for an infinite loop in the OpenTelemetry Firehose endpoint on an incomplete varint); v1.150.0 and v1.148.2 (17 August: Go 1.26.6,-enableMultitenancyViaHeaderson by default, up to 30% less CPU on multi-condition relabeling, Linode service discovery); v1.149.0 (31 July:delete_seriesanddelSeriesrestricted to POST, slowness-based re-routing on by default invminsert); Kubernetes operator v0.74.1 (4 August), v0.75.0-rc1 (3 September); VictoriaLogs v1.51.1 (18 August). - Zabbix: 7.4.14 and 7.0.30 (25 August: maximum supported TimescaleDB raised to 2.29, frontend, agent 2 and template fixes for Redis, Ceph, RabbitMQ, Check Point NGFW). No September release to date. No security advisory since 6 May.
- Centreon: 25.10 train on 2 September (
centreon-web-25.10.17,open-tickets-25.10.11,collect-25.10.12,gorgone-25.10.9,monitoring-agent-25.10.9,dsm-25.10.5); 24.10 train on 3 September (web-24.10.30,open-tickets-24.10.16,collect-24.10.24,gorgone-24.10.16,monitoring-agent-24.10.19,dsm-24.10.8) plus commercial extensions the same day;centreon-map24.10.22 and 25.10.10 on 10 September;centreon-ha25.10.3 and 24.10.4 on 6 August. Worth noting on GitHub, a 26.x line appeared on 4 August (26.07.0, hotfix 26.07.1 on 14 August) and again on 1 September (26.09.0), so far undocumented on the vendor’s site. Lifecycle: 25.10 until 04/2027, 24.10 LTS until 10/2027, 24.04 out of support. - Paessler: PRTG 26.3.122 announced on 10 August (7 new sensors including IP Reputation Score, RDP Client-Side Check, WMI Microsoft SQL Server and REST JSON Data; 10 sensors out of beta including the whole Proxmox VE family and the SSL/TLS sensors; XSS hardening; WSMAN as the default on new installations); multi-platform probe moving to QUIC announced on 9 September (Ed25519 authentication, TLS 1.3, port 23563/UDP with TCP fallback, port 23561 rules removed, target PRTG 126 by end of 2026).
- New Relic: Google Cloud Platform Observability generally available (4 August); Notebooks generally available (11 August), in the same batch of release notes as the Autopilot GitHub integration and the Jira and Ansible actions; RUNTIME conference in Atlanta (12 and 13 August); Japan region (31 August). Ground Truth is still not generally available.
- SolarWinds: 2026 State of ITSM study (press release on 18 August, detailed figures on 8 September, 844 respondents); chief executive succession announced on 26 August, Sudhakar Ramakrishna leaving on 30 September, Cullen Childress serving as interim, Samuel Monti appointed chief financial officer.
- SenHub Agent: 0.5.3 (3 August: Windows executable signing, MSI rebuilt from the signed exe); 0.5.4 (18 August: rebuilt on Go 1.26.6, OpenTelemetry train aligned with core 1.45/0.21); 0.5.5-beta (10 September: create, edit and test probes from the console with validation and trial collection, destination pages, per-probe and per-destination failure diagnosis, governance block per instance stamped onto metrics, logs and entities, owner and location inherited from the host, parameter schema declared for every probe and every output with essential-to-start marking, configured minimum TLS version actually applied to the listener, container image startable with a single variable and open to any probe). The build-generated third-party component list is on the integration branch, not yet in the published beta. Enterprise edition:
azure_container_appsprobe (Container App log stream, source-side filtering, remaining ARM call budget published, 429 handling and back-off on restart-looping containers). - Toise: v0.11.0 to v0.16.0 (11 August to 1 September):
podentity type,network.segmentwithattached_toandhas_segment, per-tenant retention bounds, MCP answers declaring their own scope and freshness,entity.delete.reasonsettled in the contract, 1.0 freeze audit opened. - Ecosystem: Go 1.26.6 (10 security fixes, 11 to 13 August); OpenTelemetry, semantic conventions v1.44.0 (4 August), specification v1.60.0 (7 August), Collector v0.158.0 to v0.160.0 (4 August to 2 September).
This watch is monthly. The next edition will cover October 2026. To receive it automatically, the newsletter sign-up is at the bottom of the page.